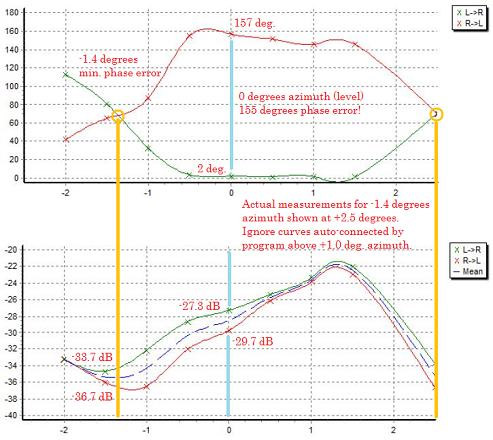
From the graphs you can see the phase error at 0 degrees azimuth was huge: 155 degrees! Where the curves in the upper graph cross at -1.4 degrees azimuth angle, there is zero phase error, which is readily audible to the untrained ear. The crosstalk figures at this azimuth setting reflect improvements up to 7 dB, which again is huge! (a 10 dB difference is twice or half as loud) The ear is more sensitive to phase error than crosstalk, so -1.4 degrees was selected as the optimum azimuth setting.
From the moment the stylus hit the groove, the differences were mind boggling. Everything from top to bottom was clearer, better defined, with dramatically less noise and grain. The client raved about it the improvements and continues to say how it’s almost as if he’s hearing each record again for the first time. He laughed, saying he never would have deliberately put the cartridge and arm at a funny angle like that, but sure enough he heard the difference right away. Every client has said the same things. We’re batting 1.000!
Whether the perfect azimuth setting for your system is as little as a few tenths of a degree from where it is now or even more than what’s shown in this example, you’ll hear the improvements time and again. Your favorite records will last longer, and so will your stylus.
It’s truly the biggest bang for the buck improvement you can make to your system. Your ears will thank you!
For further information, kindly refer to: http://www.adjustplus.de/index.php?lang=english
 An example of what the correct azimuth setting will do for you
The client in this case listens to vinyl only and carefully maintains his records and keeps his equipment in perfect adjustment. Accordingly, the cartridge body was perfectly level, parallel to the record surface.

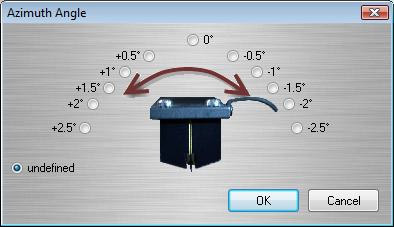
The graphs above, generated by the software program, show the phase response (upper graph) and crosstalk (lower graph) measurements taken for different azimuth angles (shown on the horizontal axes). The light blue vertical lines highlight the measurements taken at zero degrees azimuth angle, the initial setting, while the yellow vertical line toward the left side of the graphs highlights the measurements taken at the optimum azimuth angle of -1.4 degrees. Because the software program is configured for azimuth angles in 0.5 degree steps, for measurements at the final azimuth setting of -1.4 degrees we “pretended” to the program that the azimuth was at +2.5 degrees — a region that’s not of interest since crosstalk is increasing for positive azimuth angles and phase error is relatively unchanging.